Management Console Tour
The NF management console is a web-based interface for configuring and monitoring your deployment. This page walks through the main sections so you know where to find things.
Access the console at http://<your-host-ip>:8080 after deployment.
Dashboard
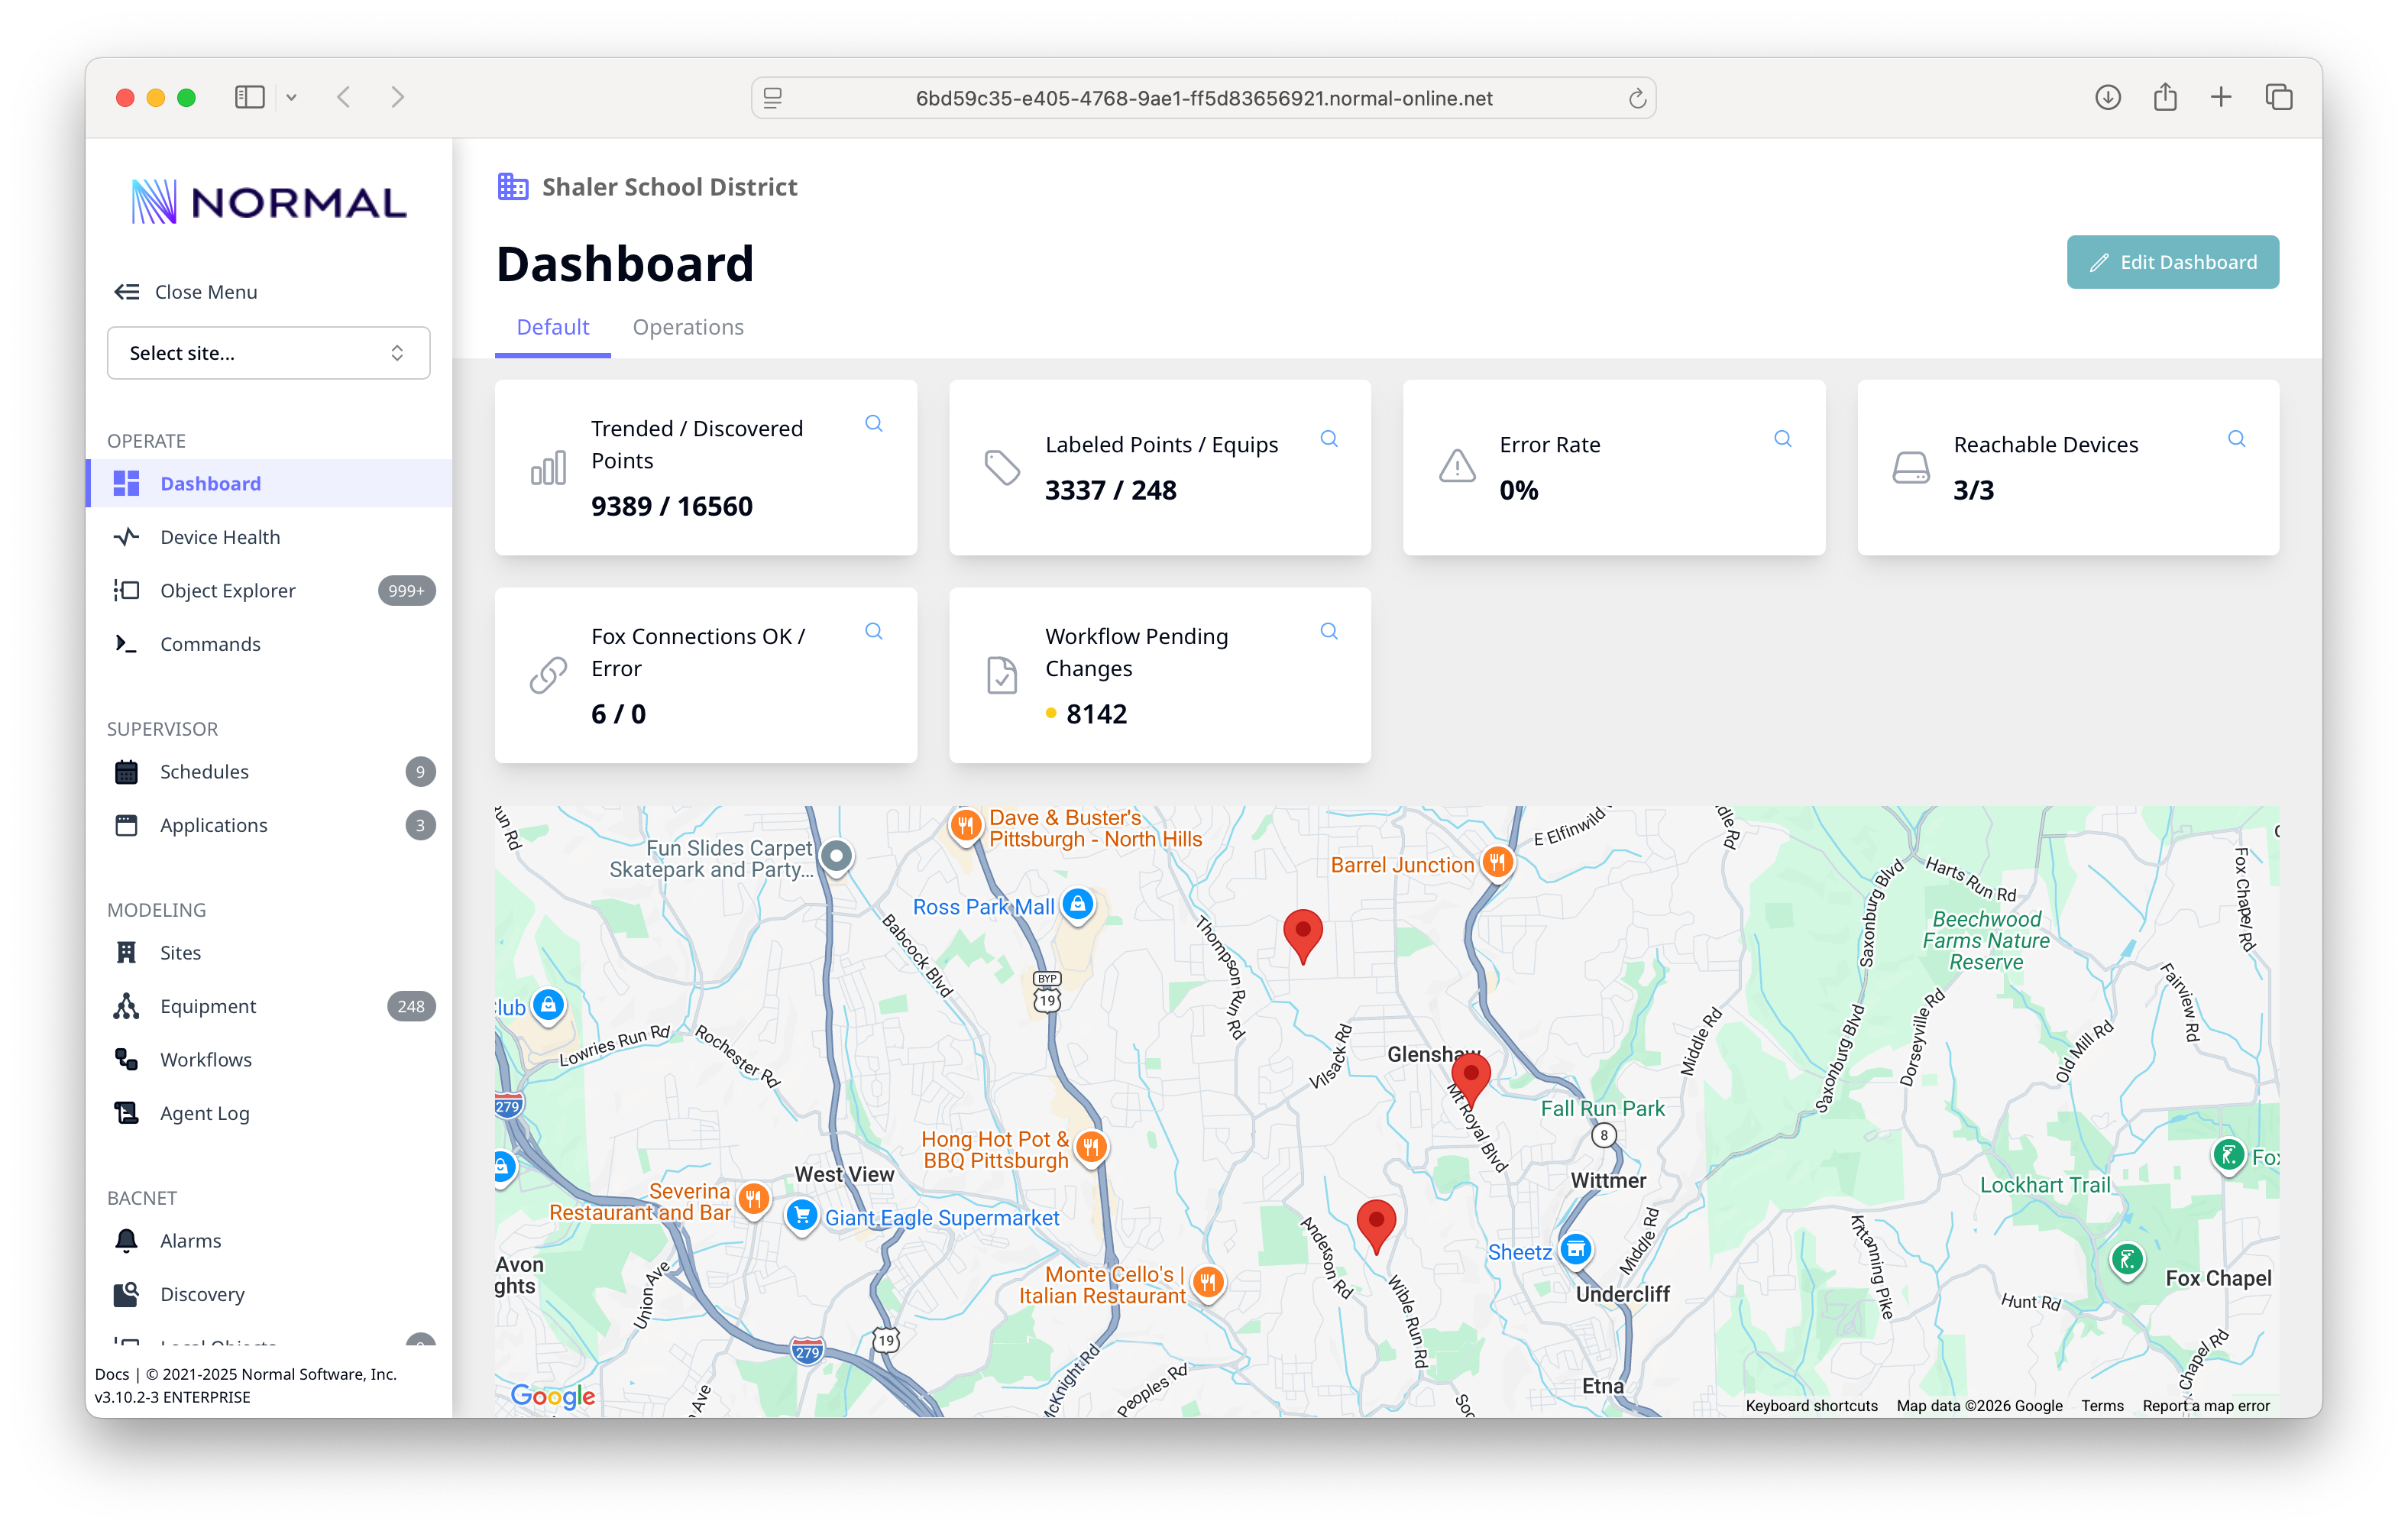
The dashboard is your landing page. It shows:
- Trended / Discovered Points -- how many points are actively collecting data vs. total discovered
- Labeled Points / Equipment -- modeling progress at a glance
- Error Rate -- percentage of failed polls across all devices
- Reachable Devices -- how many devices are currently communicating
- Fox Connections -- status of Niagara station connections
- Workflow Pending Changes -- modeling changes waiting to be applied
- Site Map -- geographic view of your buildings with pins
Device Health
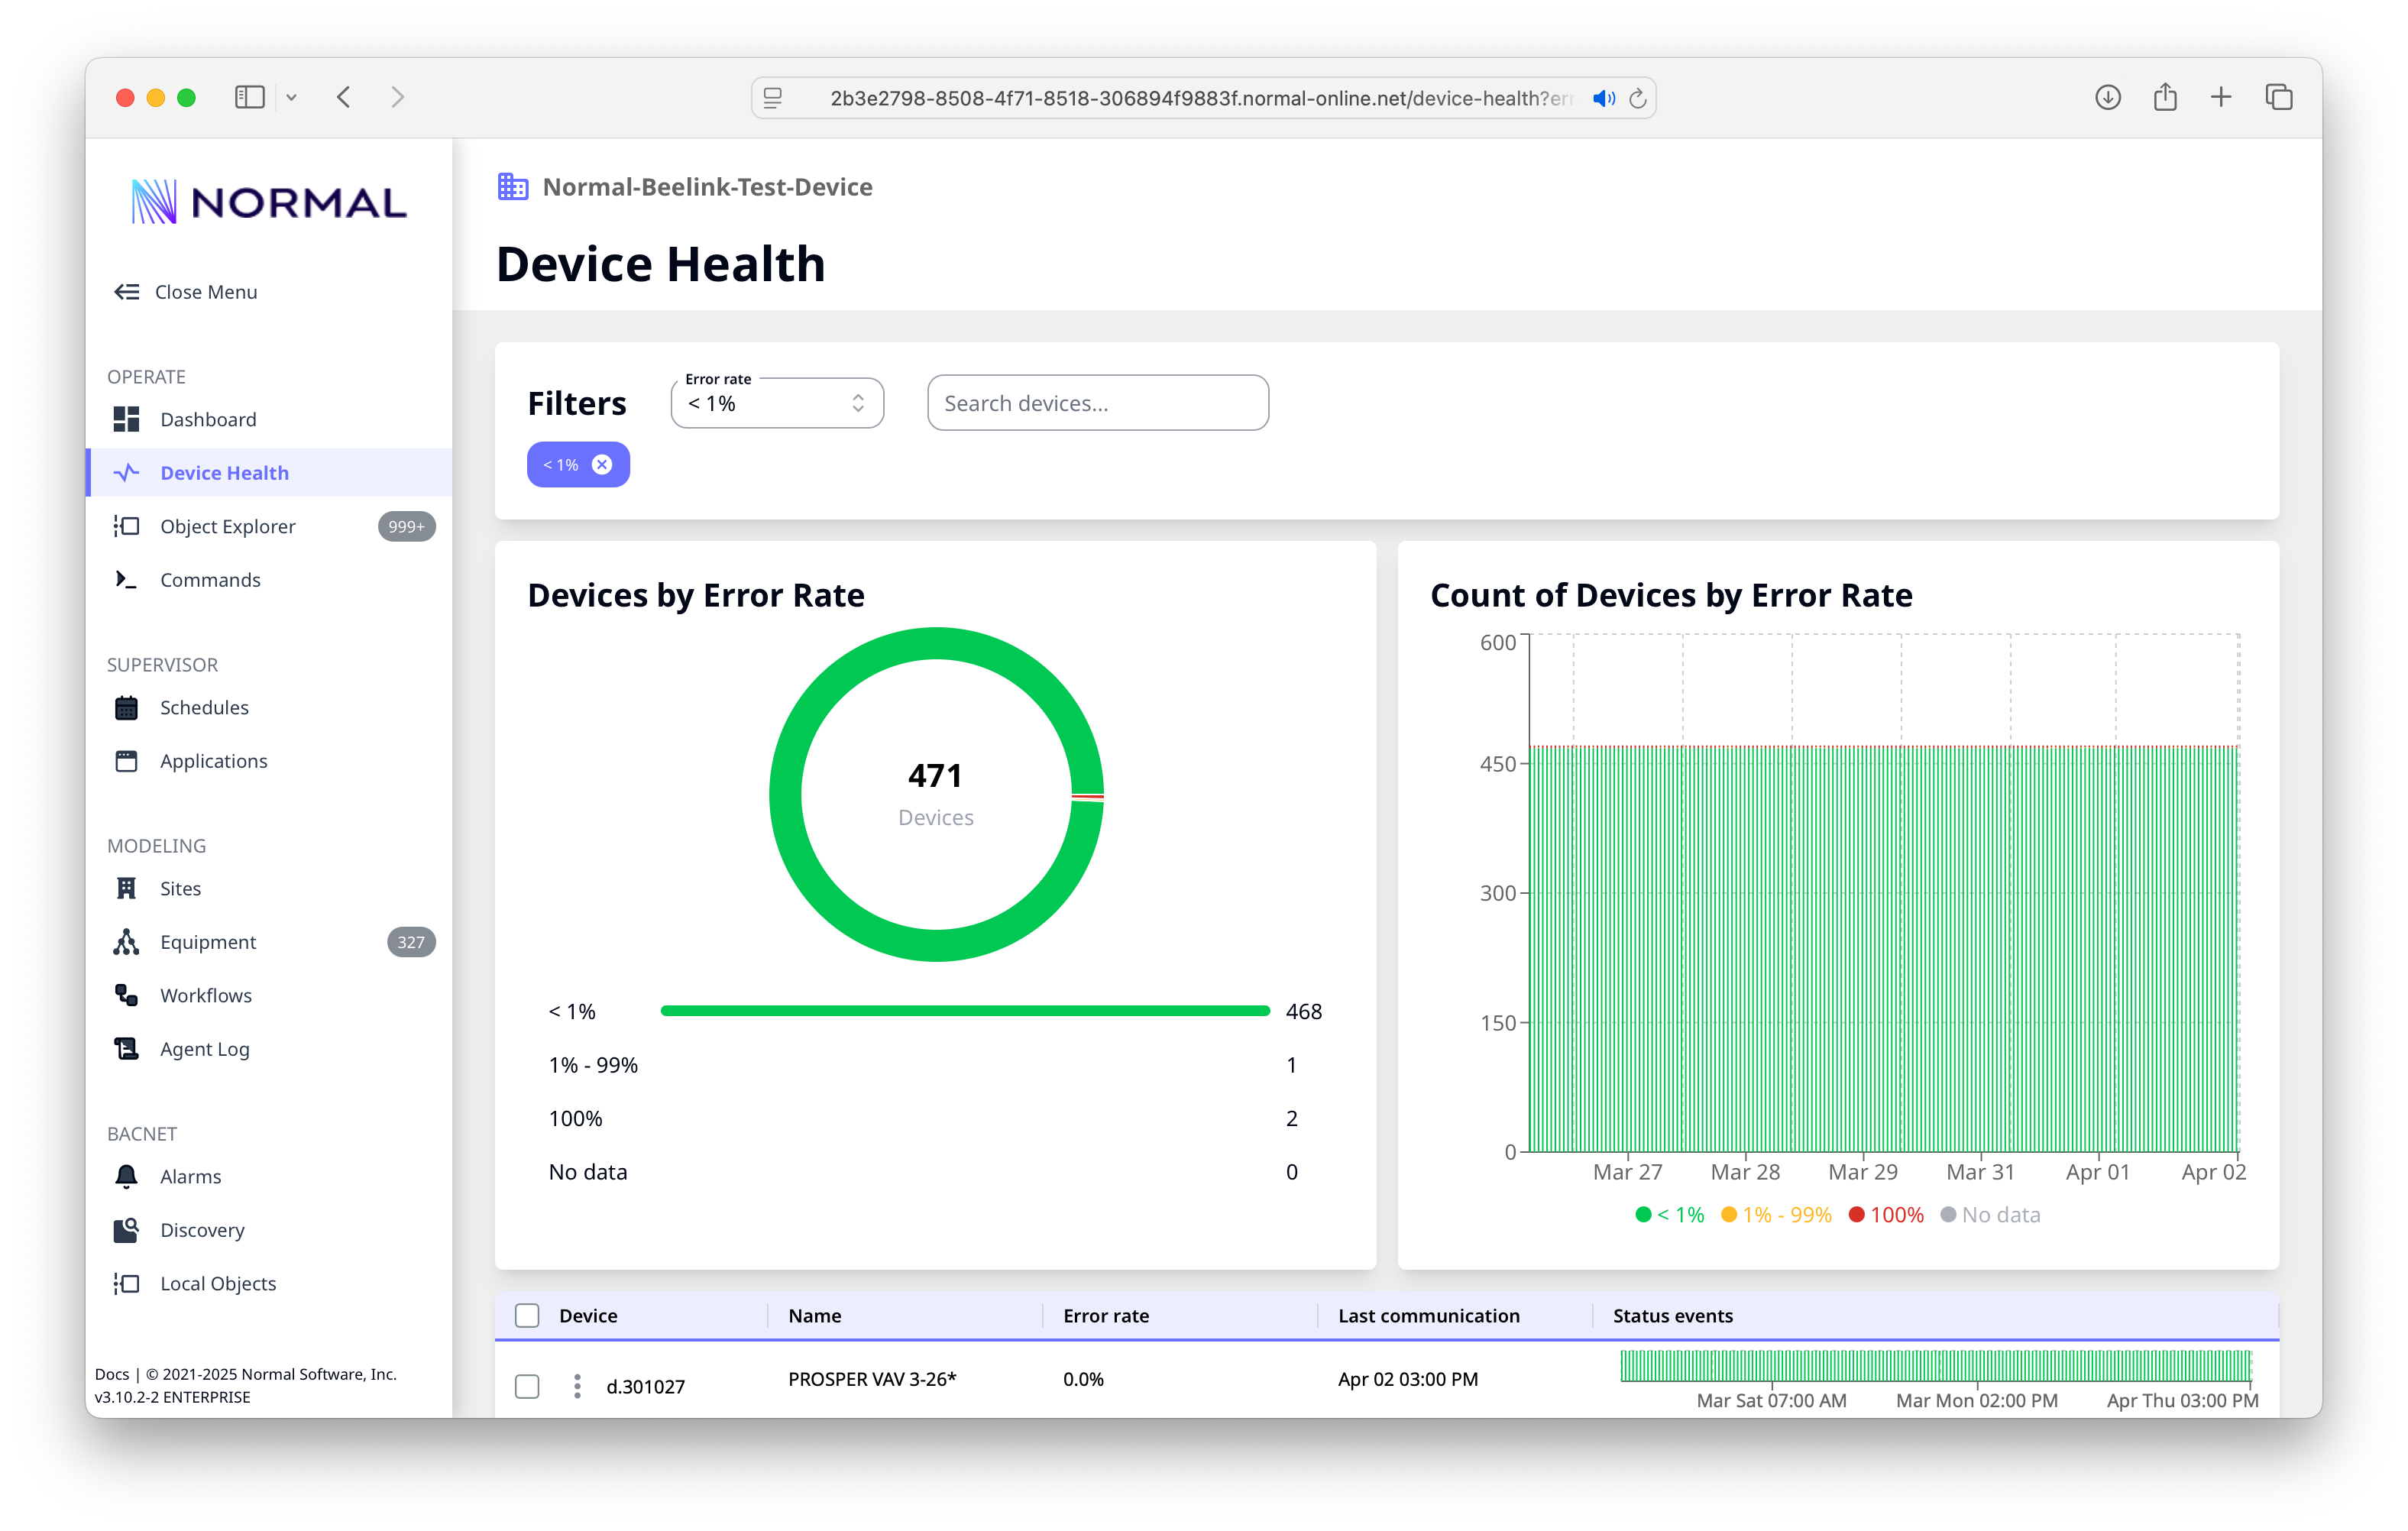
The Device Health page gives you a fleet-level view of communication reliability:
- Error rate donut -- breakdown of devices by error rate bucket
- Historical trend -- device reachability over time
- Device table -- per-device error rate, last communication time, and a status timeline showing uptime patterns
Use the error rate filter to quickly find troubled devices.
Object Explorer
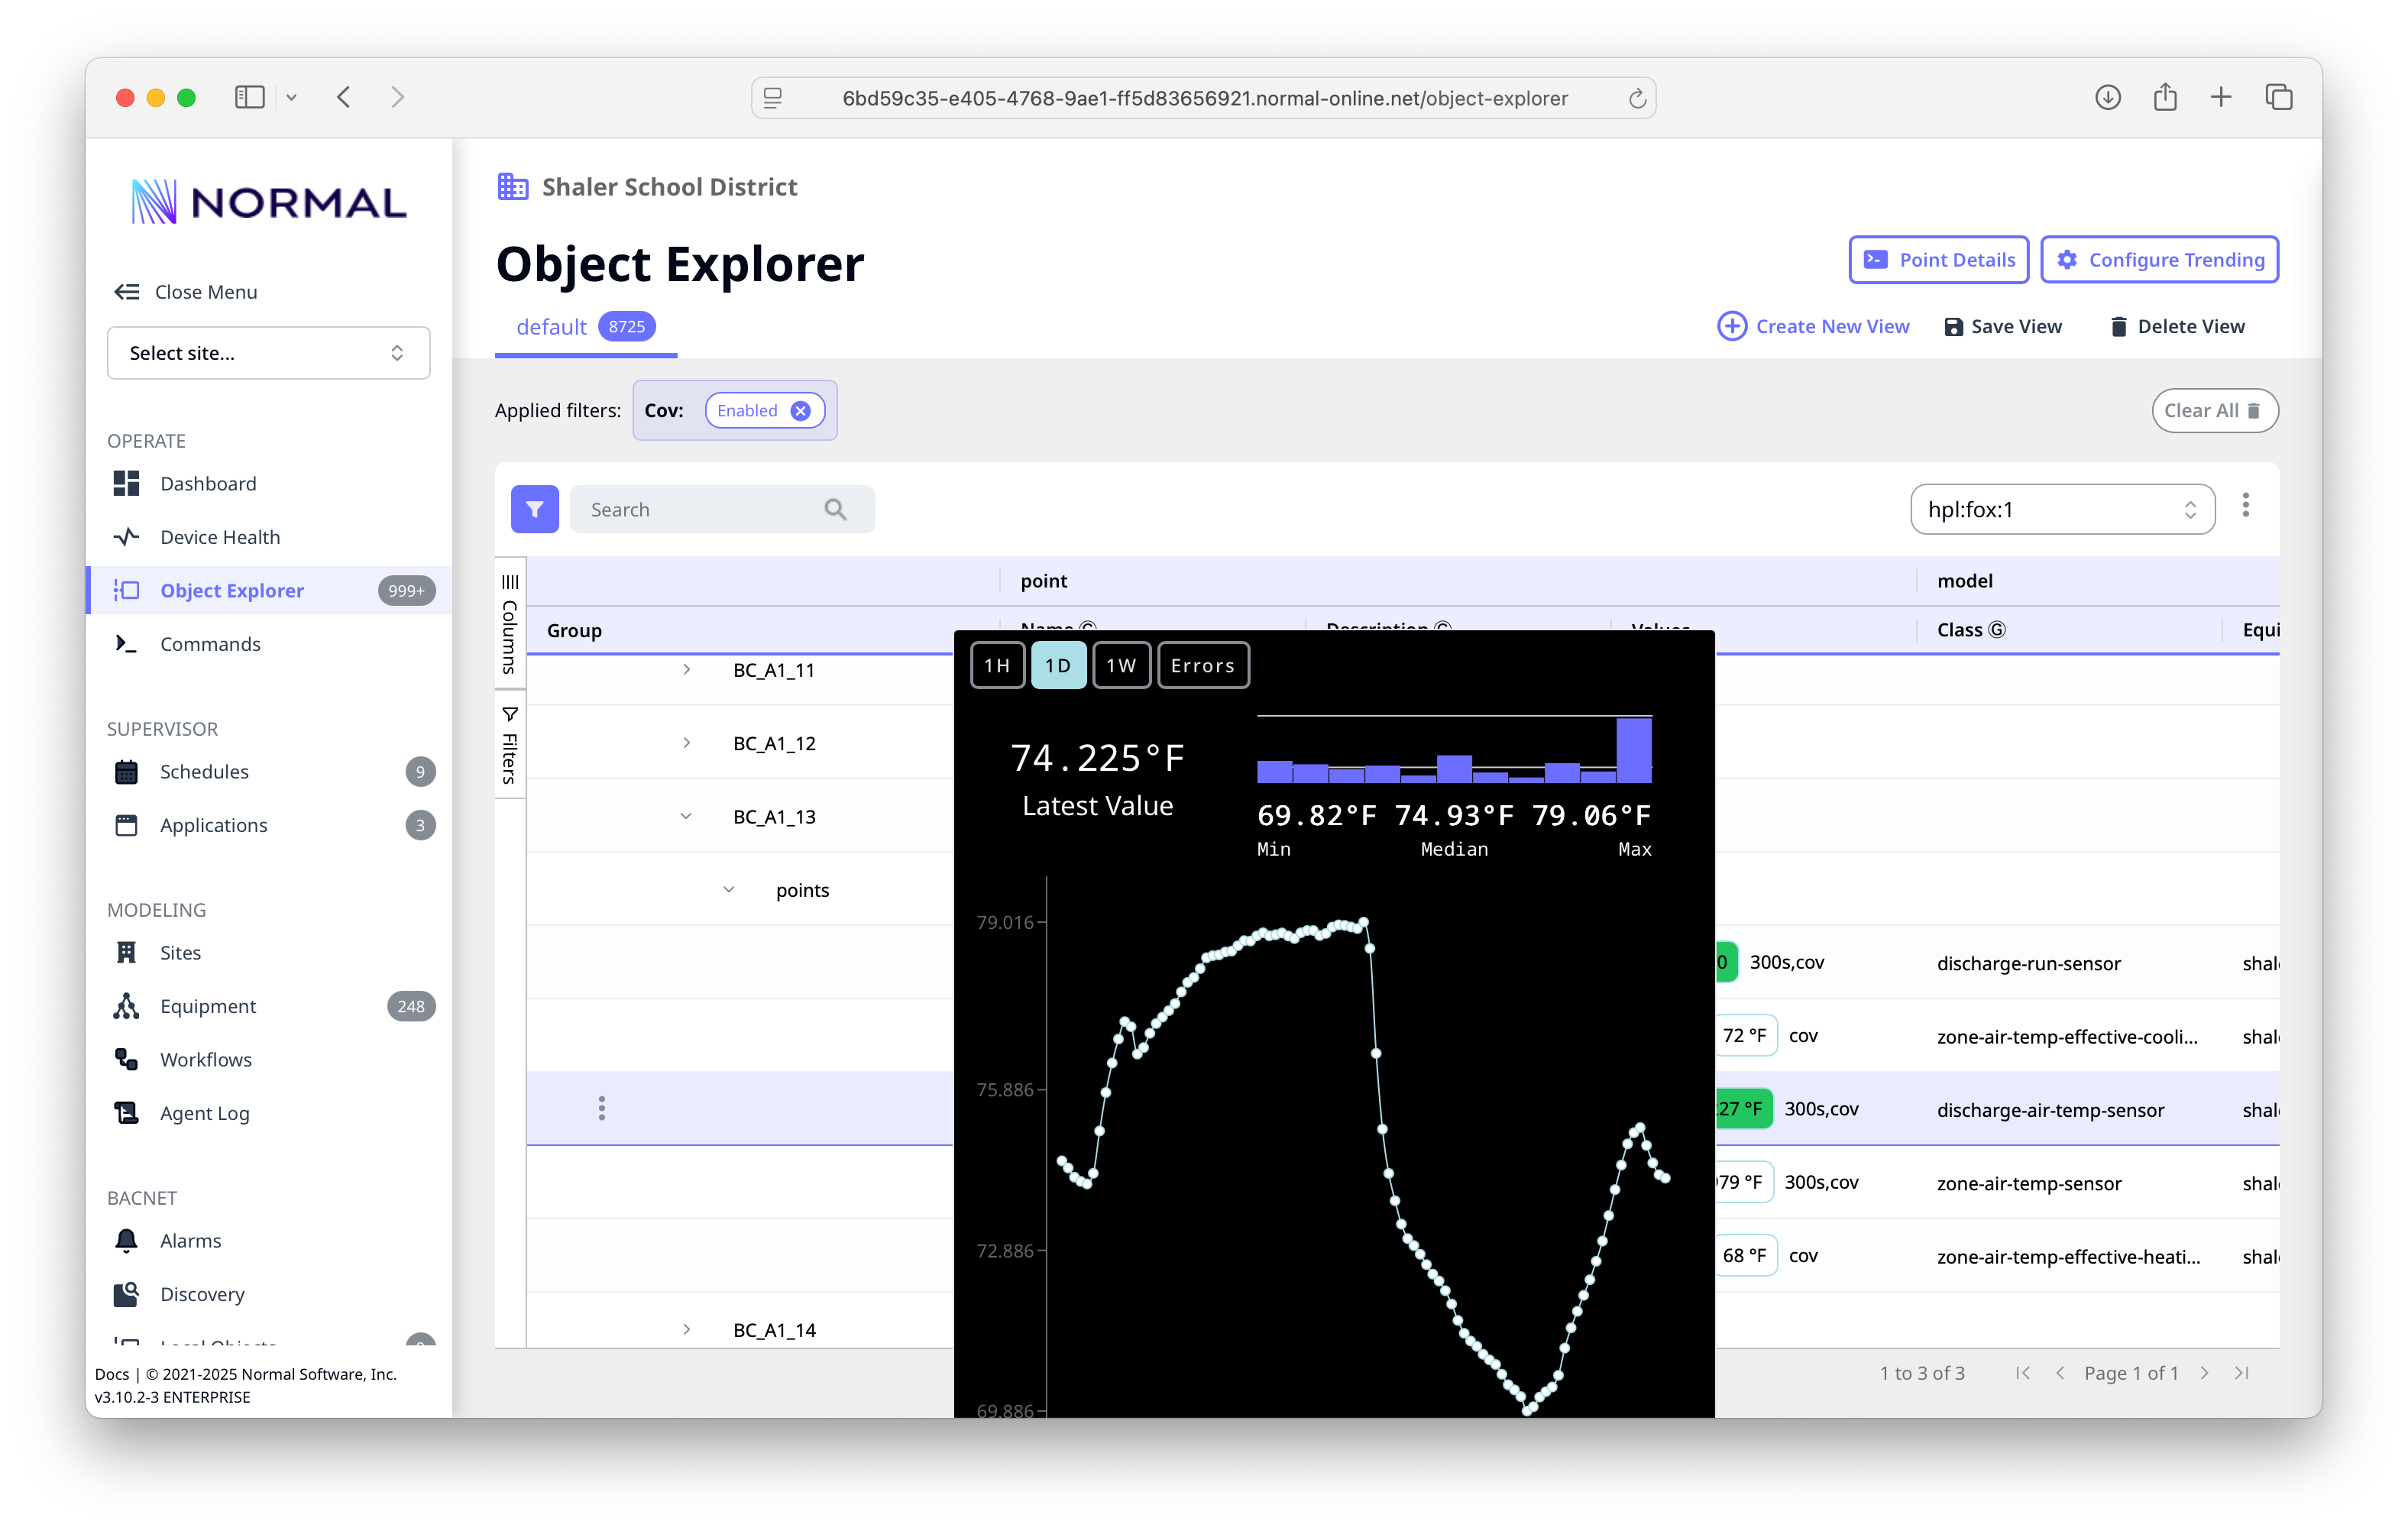
The Object Explorer is where you spend most of your time. It provides a searchable, filterable view of every point in your system.
Key features:
- Search -- find points by name, device, or any metadata
- Filters -- narrow by site, protocol, device, or point type
- Grouping -- expand device groups to see their objects
- Trend popup -- click a point to see its current value, statistics (min/median/max), and a time-series chart
- Bulk actions -- select multiple points to set poll periods, assign sites, or apply tags
- Views -- save custom column layouts and filters as named views
Tip
Right-click on points or selections for a context menu with common actions like Set Poll Period, Assign Site, and Tag Points.
Discovery
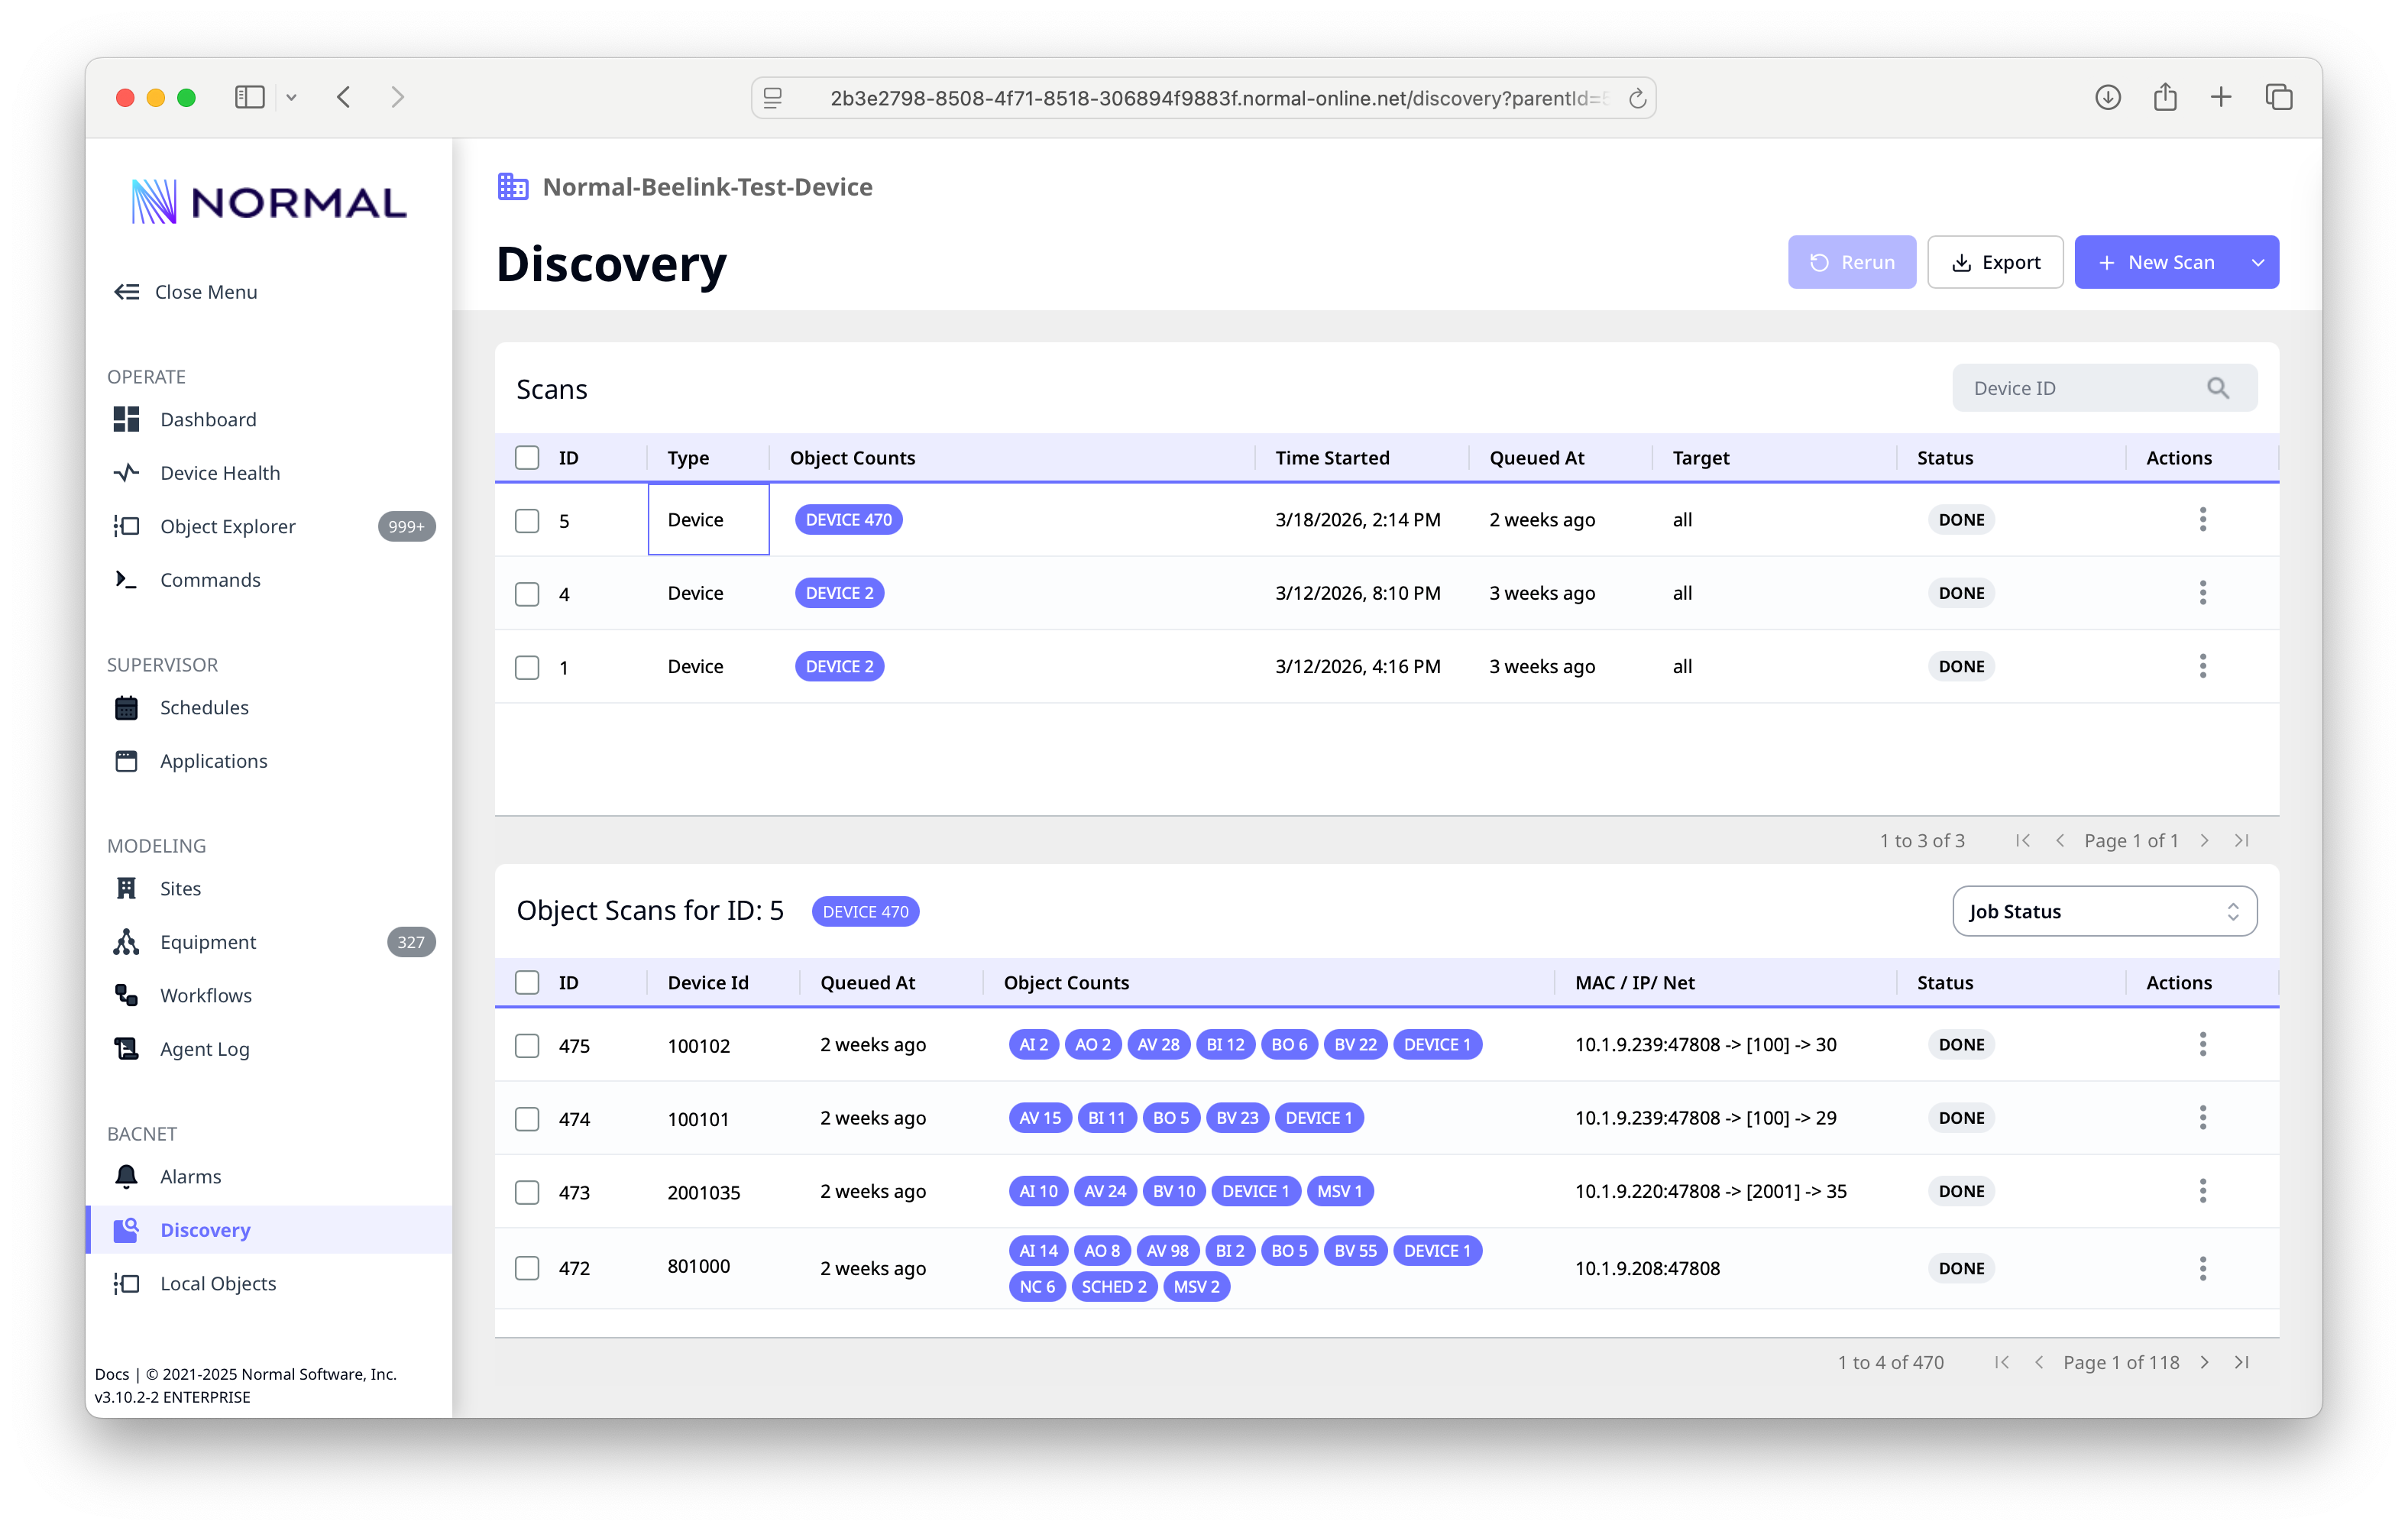
The Discovery page manages BACnet device scanning.
- New Scan -- start a device discovery or object scan
- Scan history -- past scans with type, object counts, timestamps, and status
- Object drill-down -- expand a scan to see per-device results with object type breakdowns (AI, AO, AV, BI, BO, BV, etc.)
- Rerun -- re-execute a previous scan with the same parameters
- Export -- download scan results
Sites
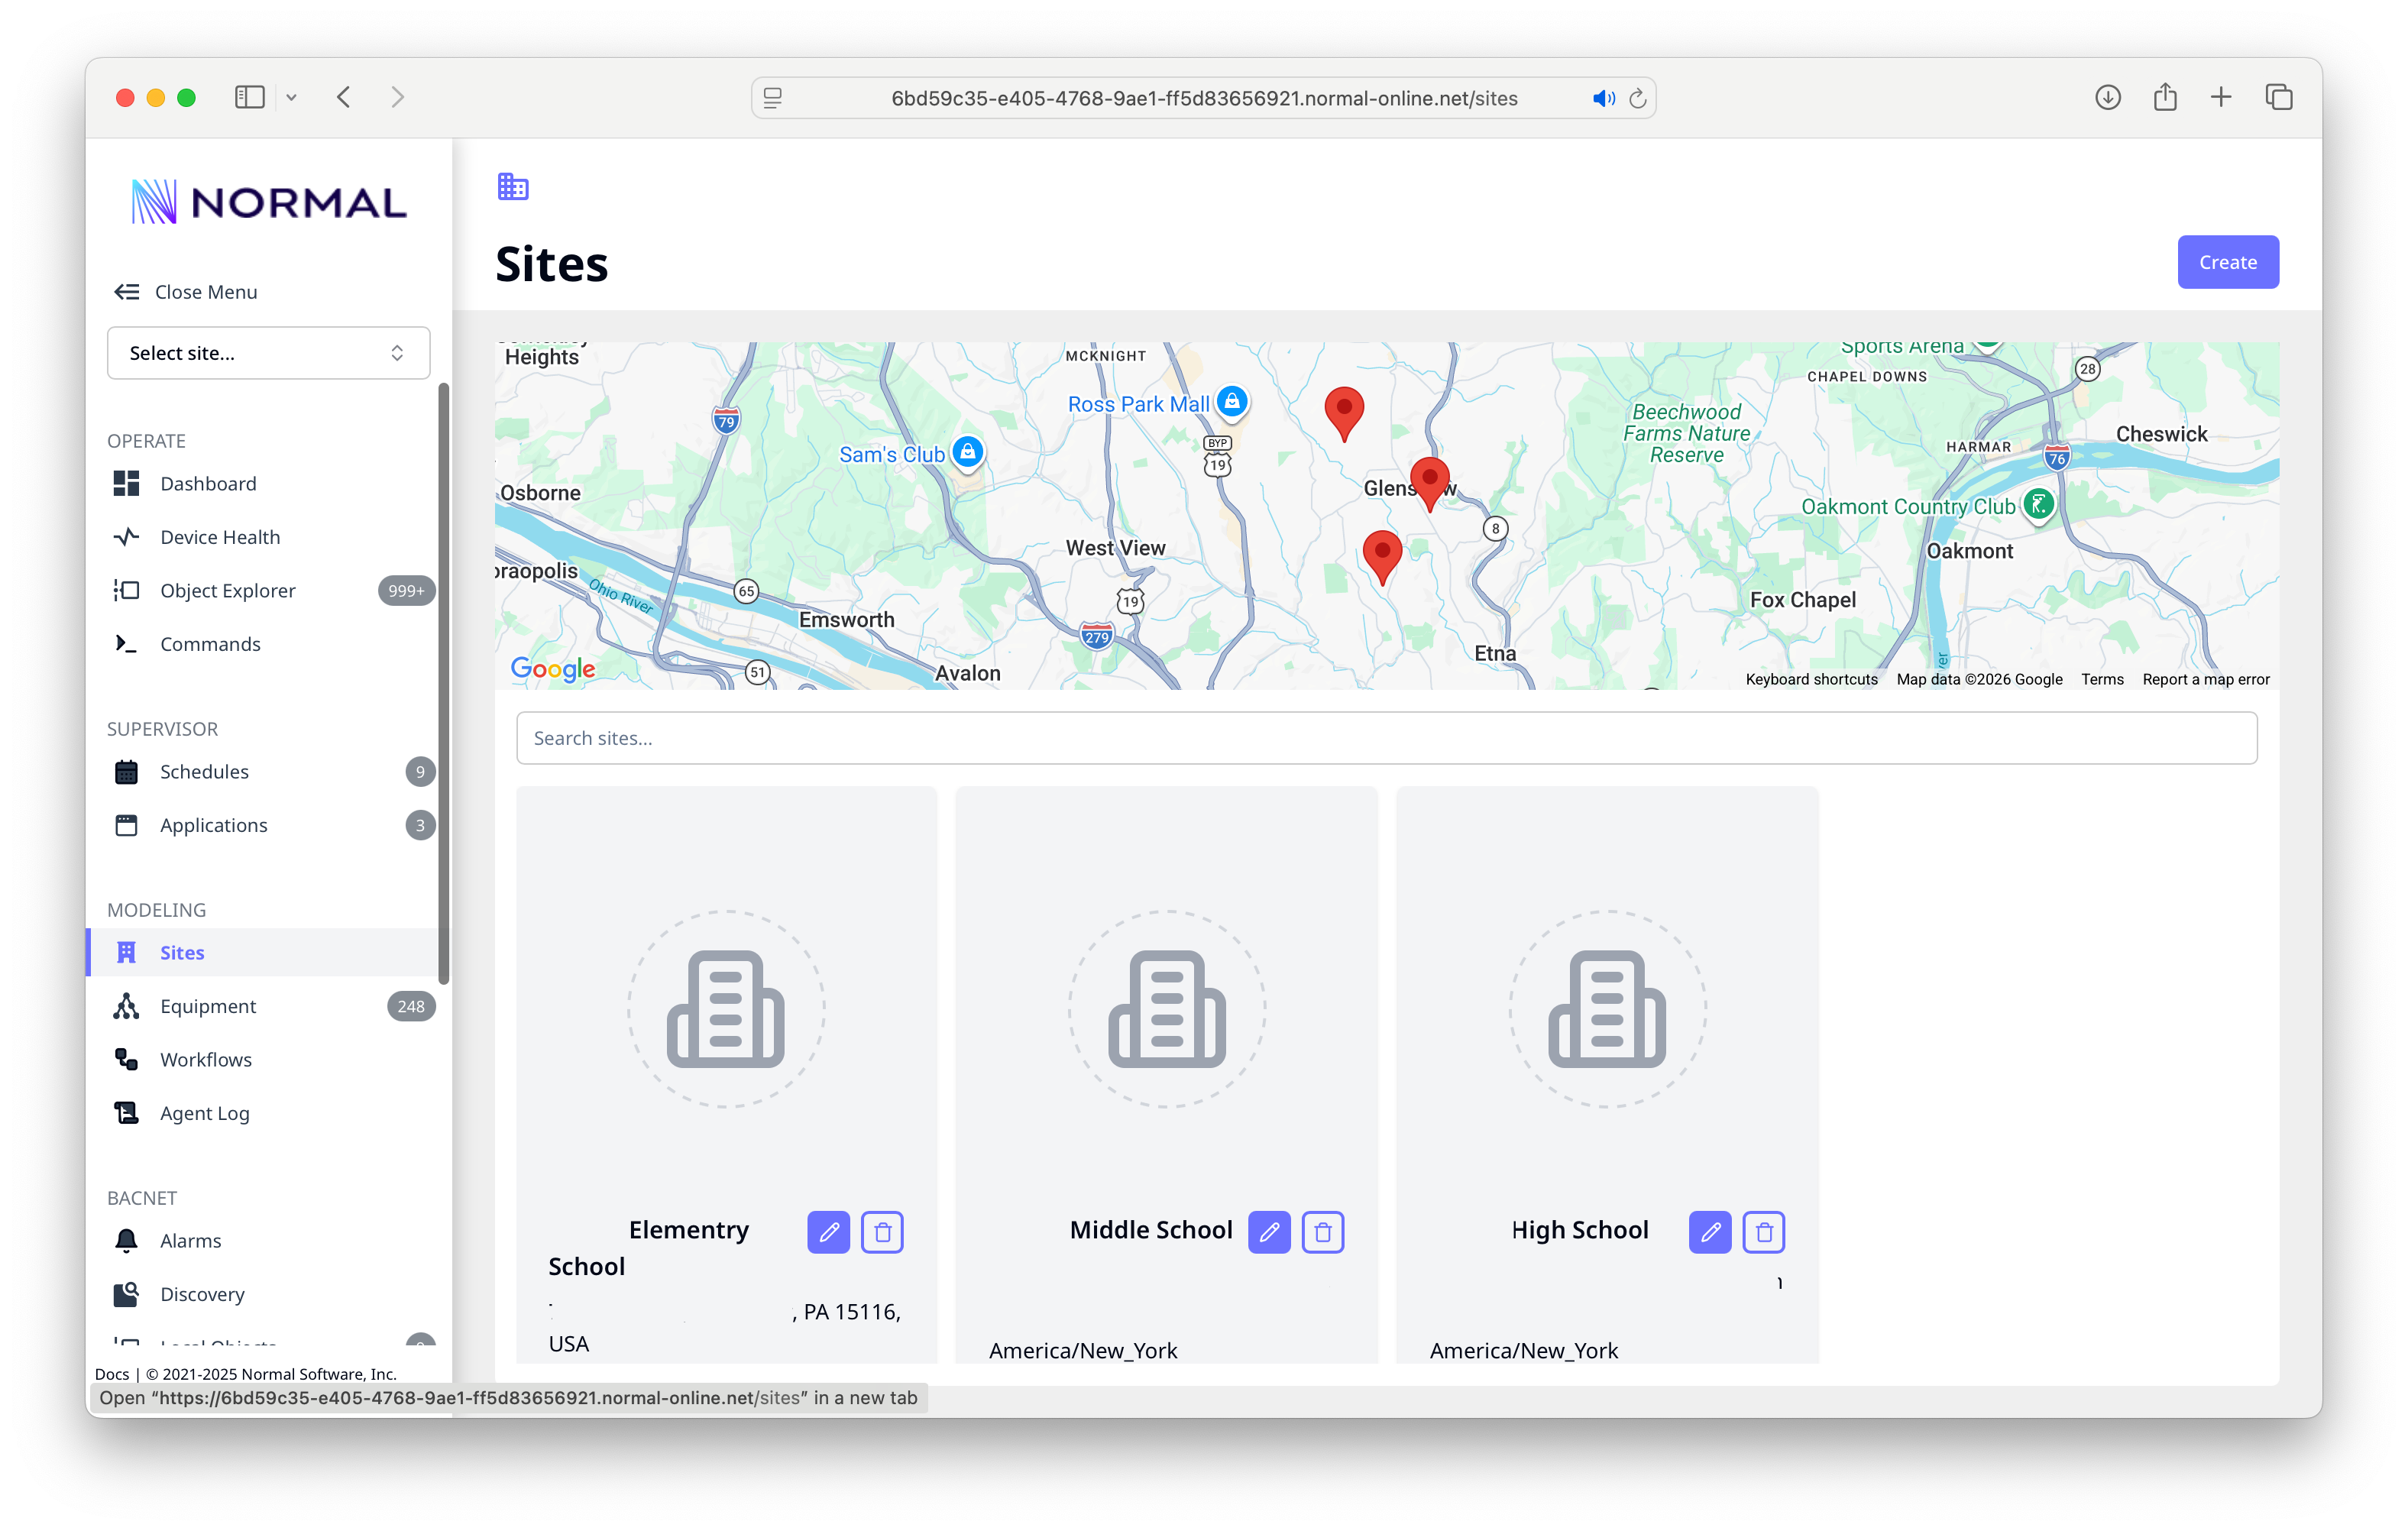
Manage your buildings and locations:
- Map view -- all sites plotted on a map
- Site cards -- each building with name, address, timezone, and edit/delete controls
- Create -- add a new site with address auto-lookup for timezone and coordinates
Click a site card to edit its properties.
Equipment
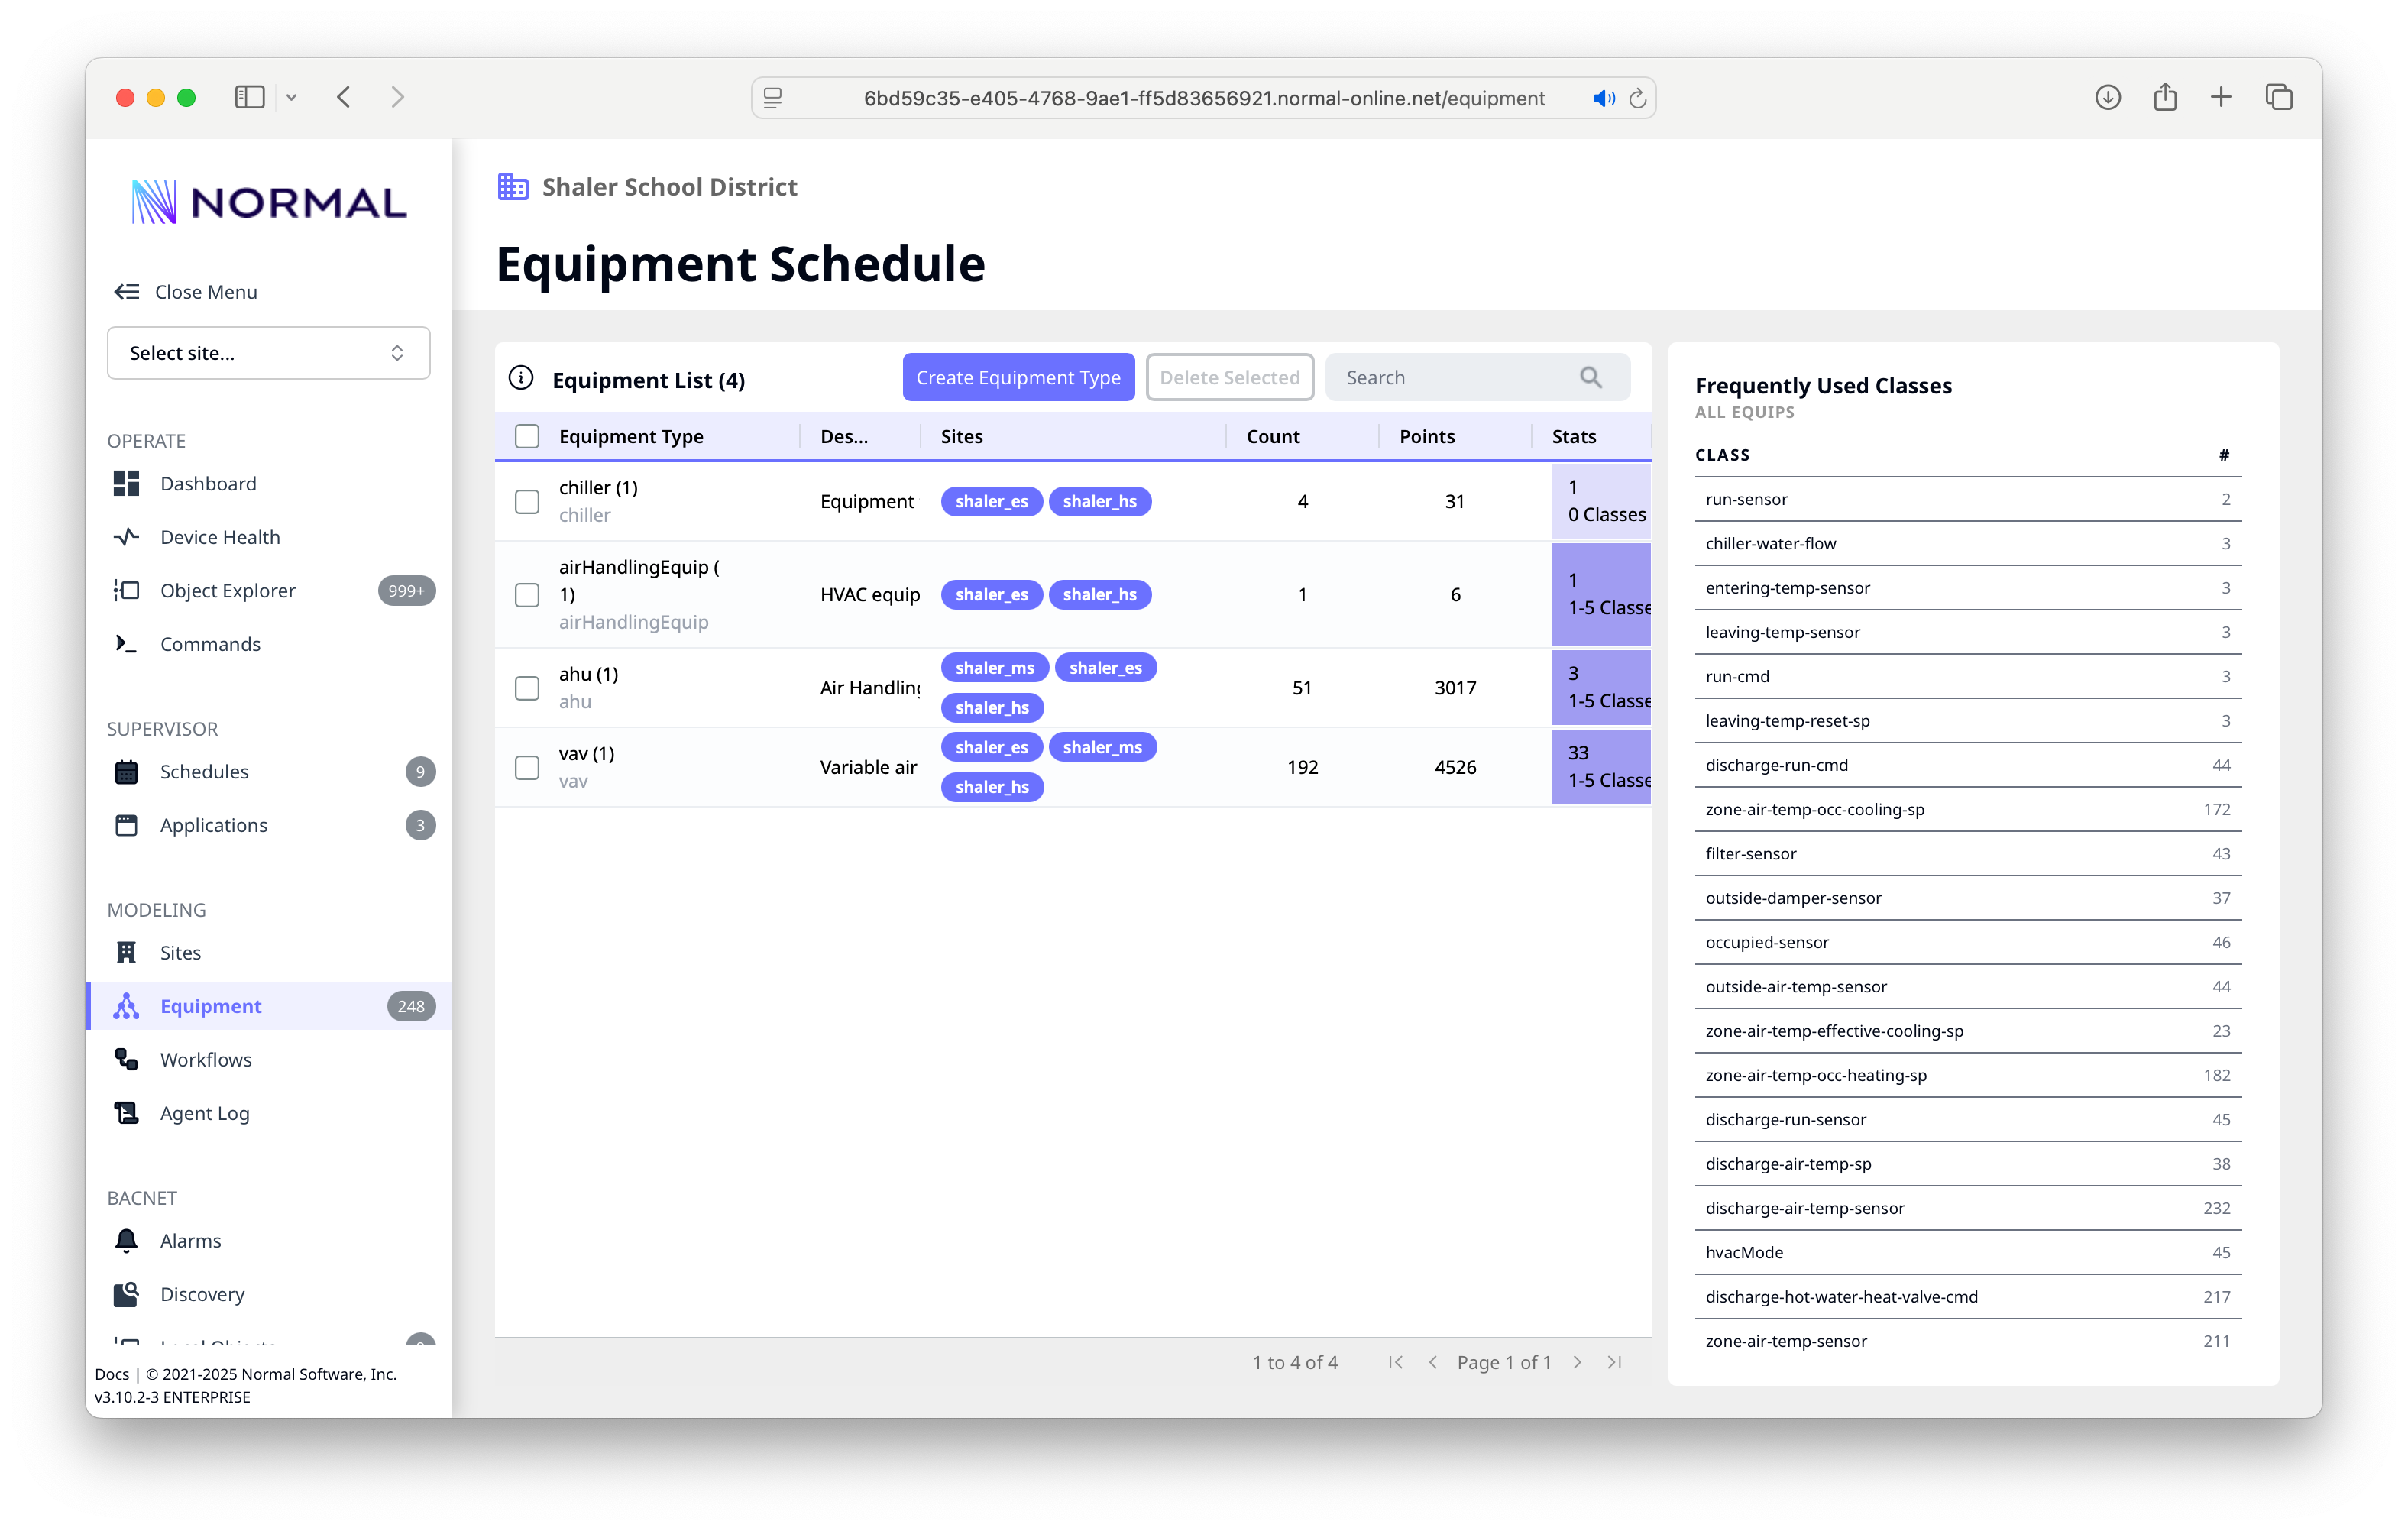
The Equipment page shows your system model:
- Equipment types -- grouped by type (chiller, AHU, VAV, etc.) with instance counts and point totals
- Site tags -- which sites each equipment type spans
- Stats -- classification completeness per equipment type
- Frequently Used Classes -- sidebar showing the most common point classes across your model with counts
Schedules
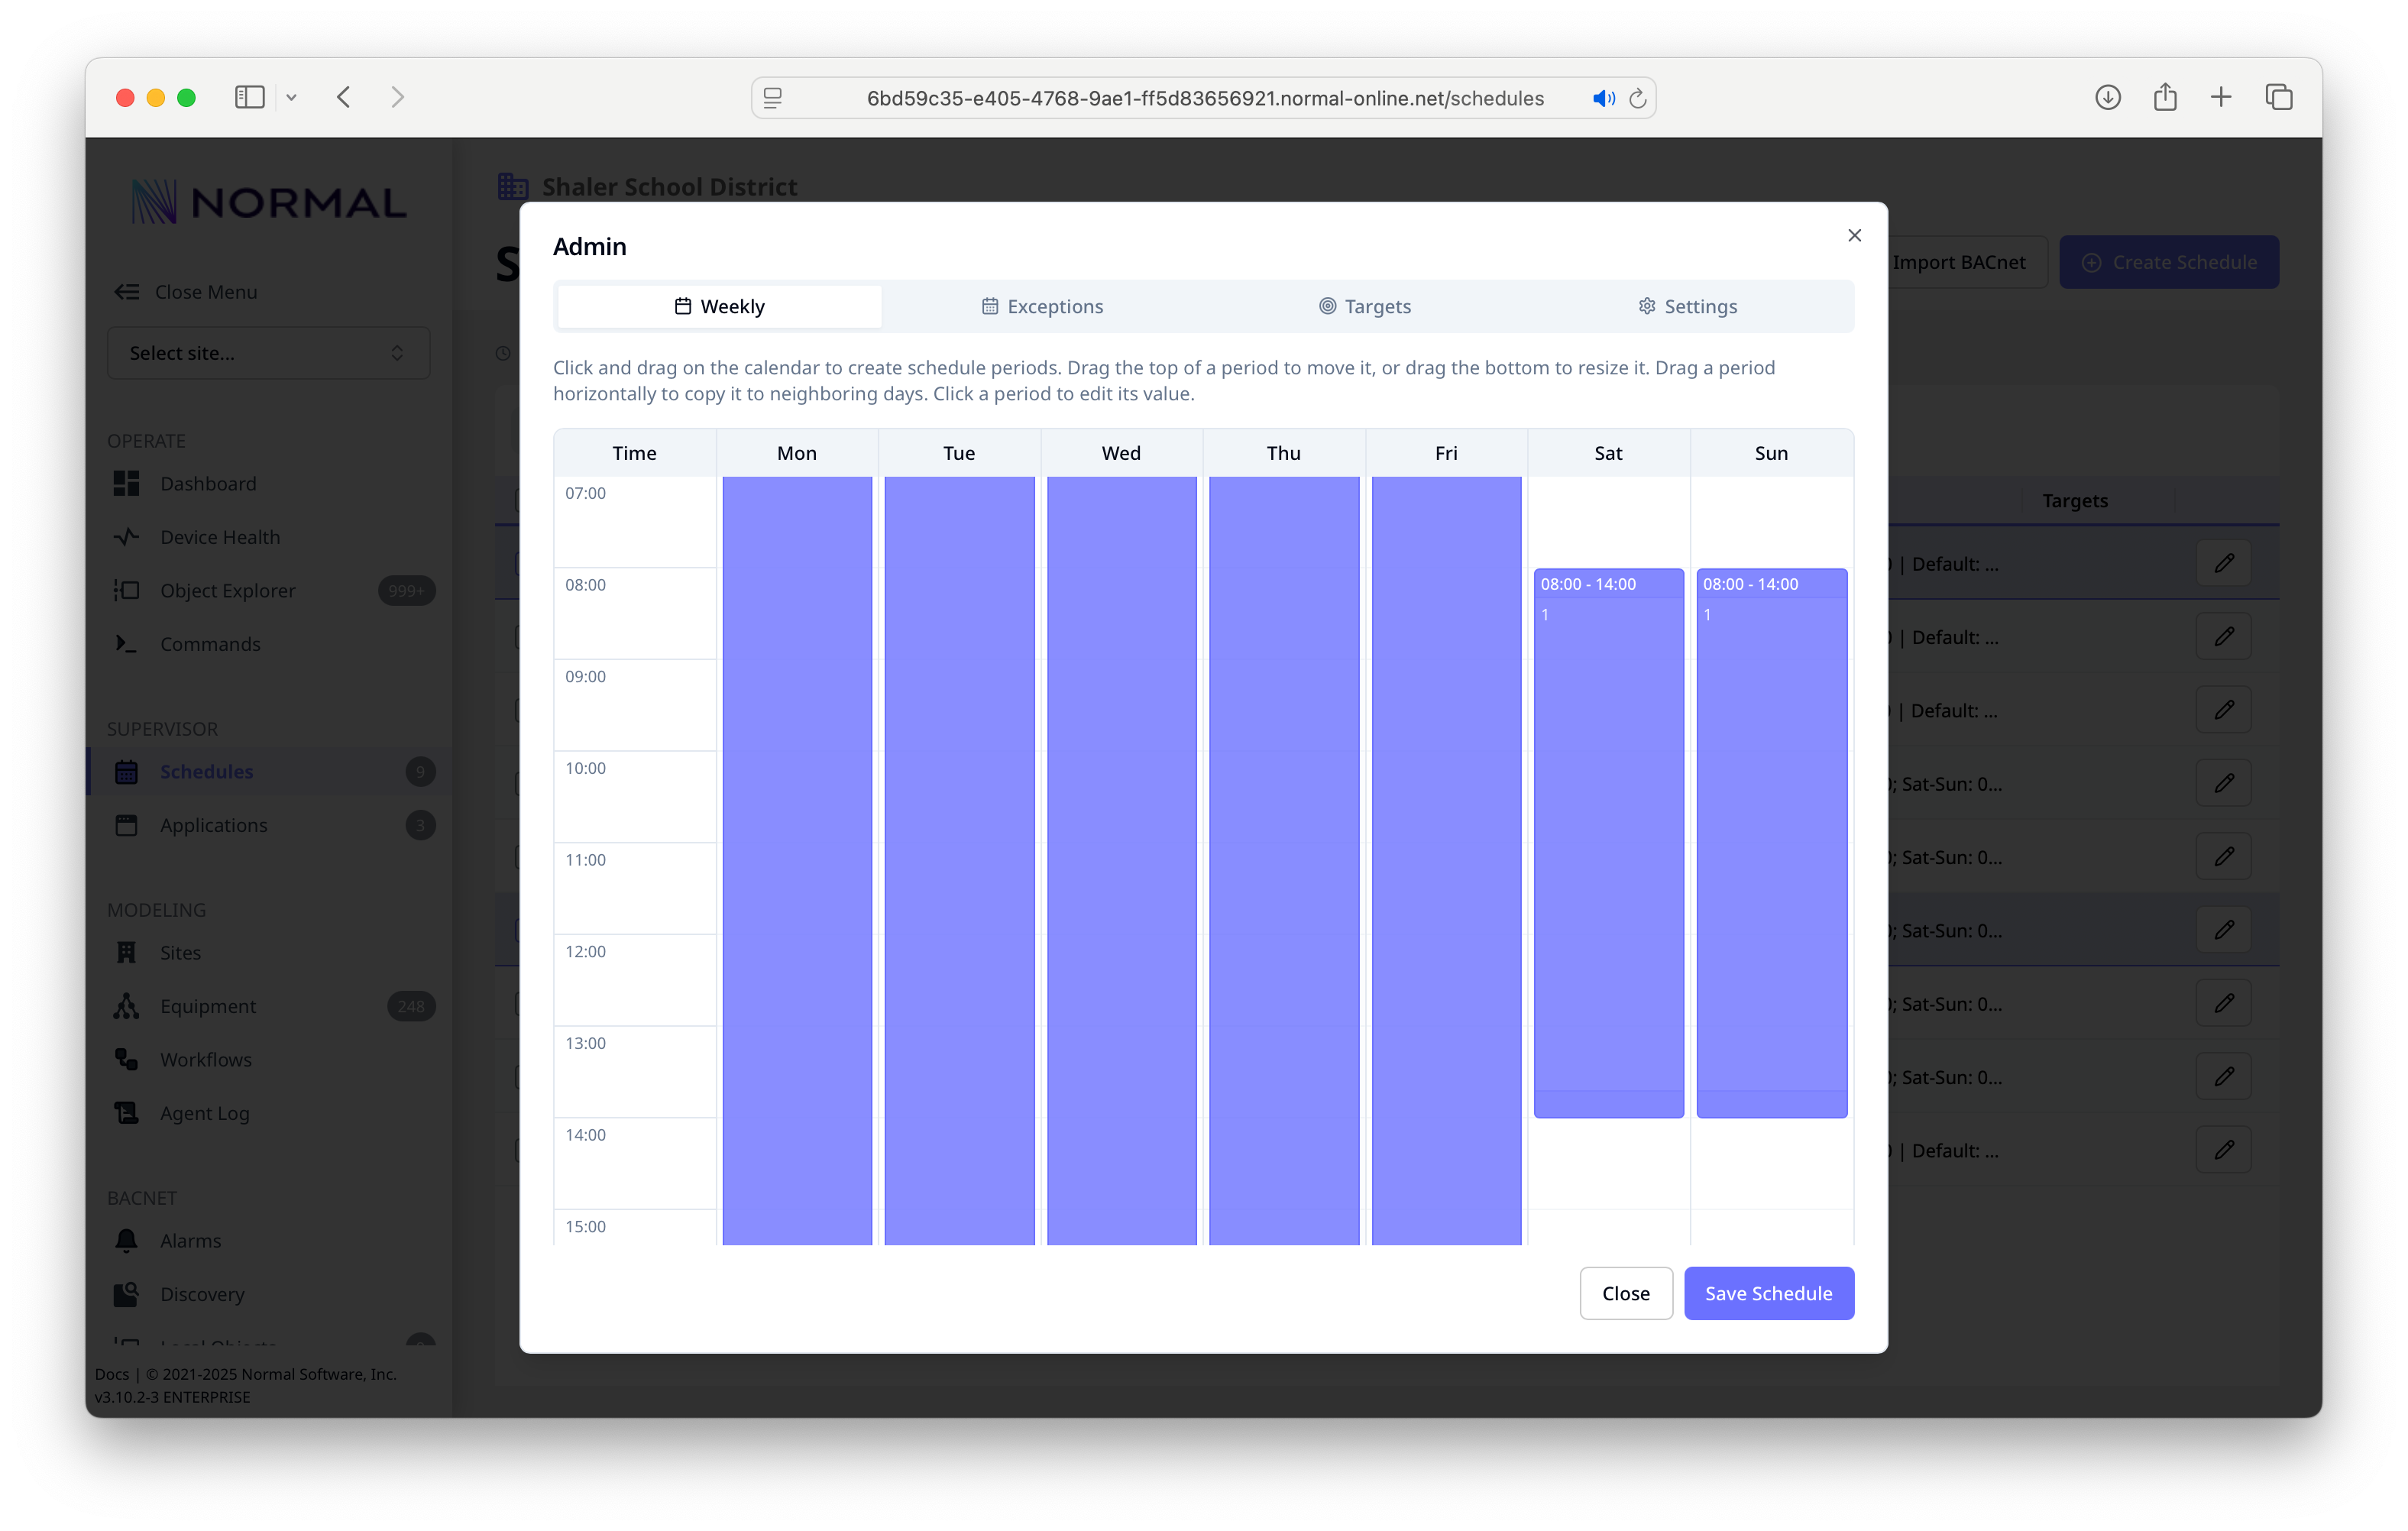
The Schedule editor provides a visual weekly timetable:
- Weekly view -- drag to create time blocks, resize to adjust, drag horizontally to copy to other days
- Exceptions -- holiday and one-time overrides
- Targets -- which points or commands the schedule drives
- Settings -- schedule metadata and sync options
- BACnet sync -- bidirectional sync with BACnet schedule objects
Applications
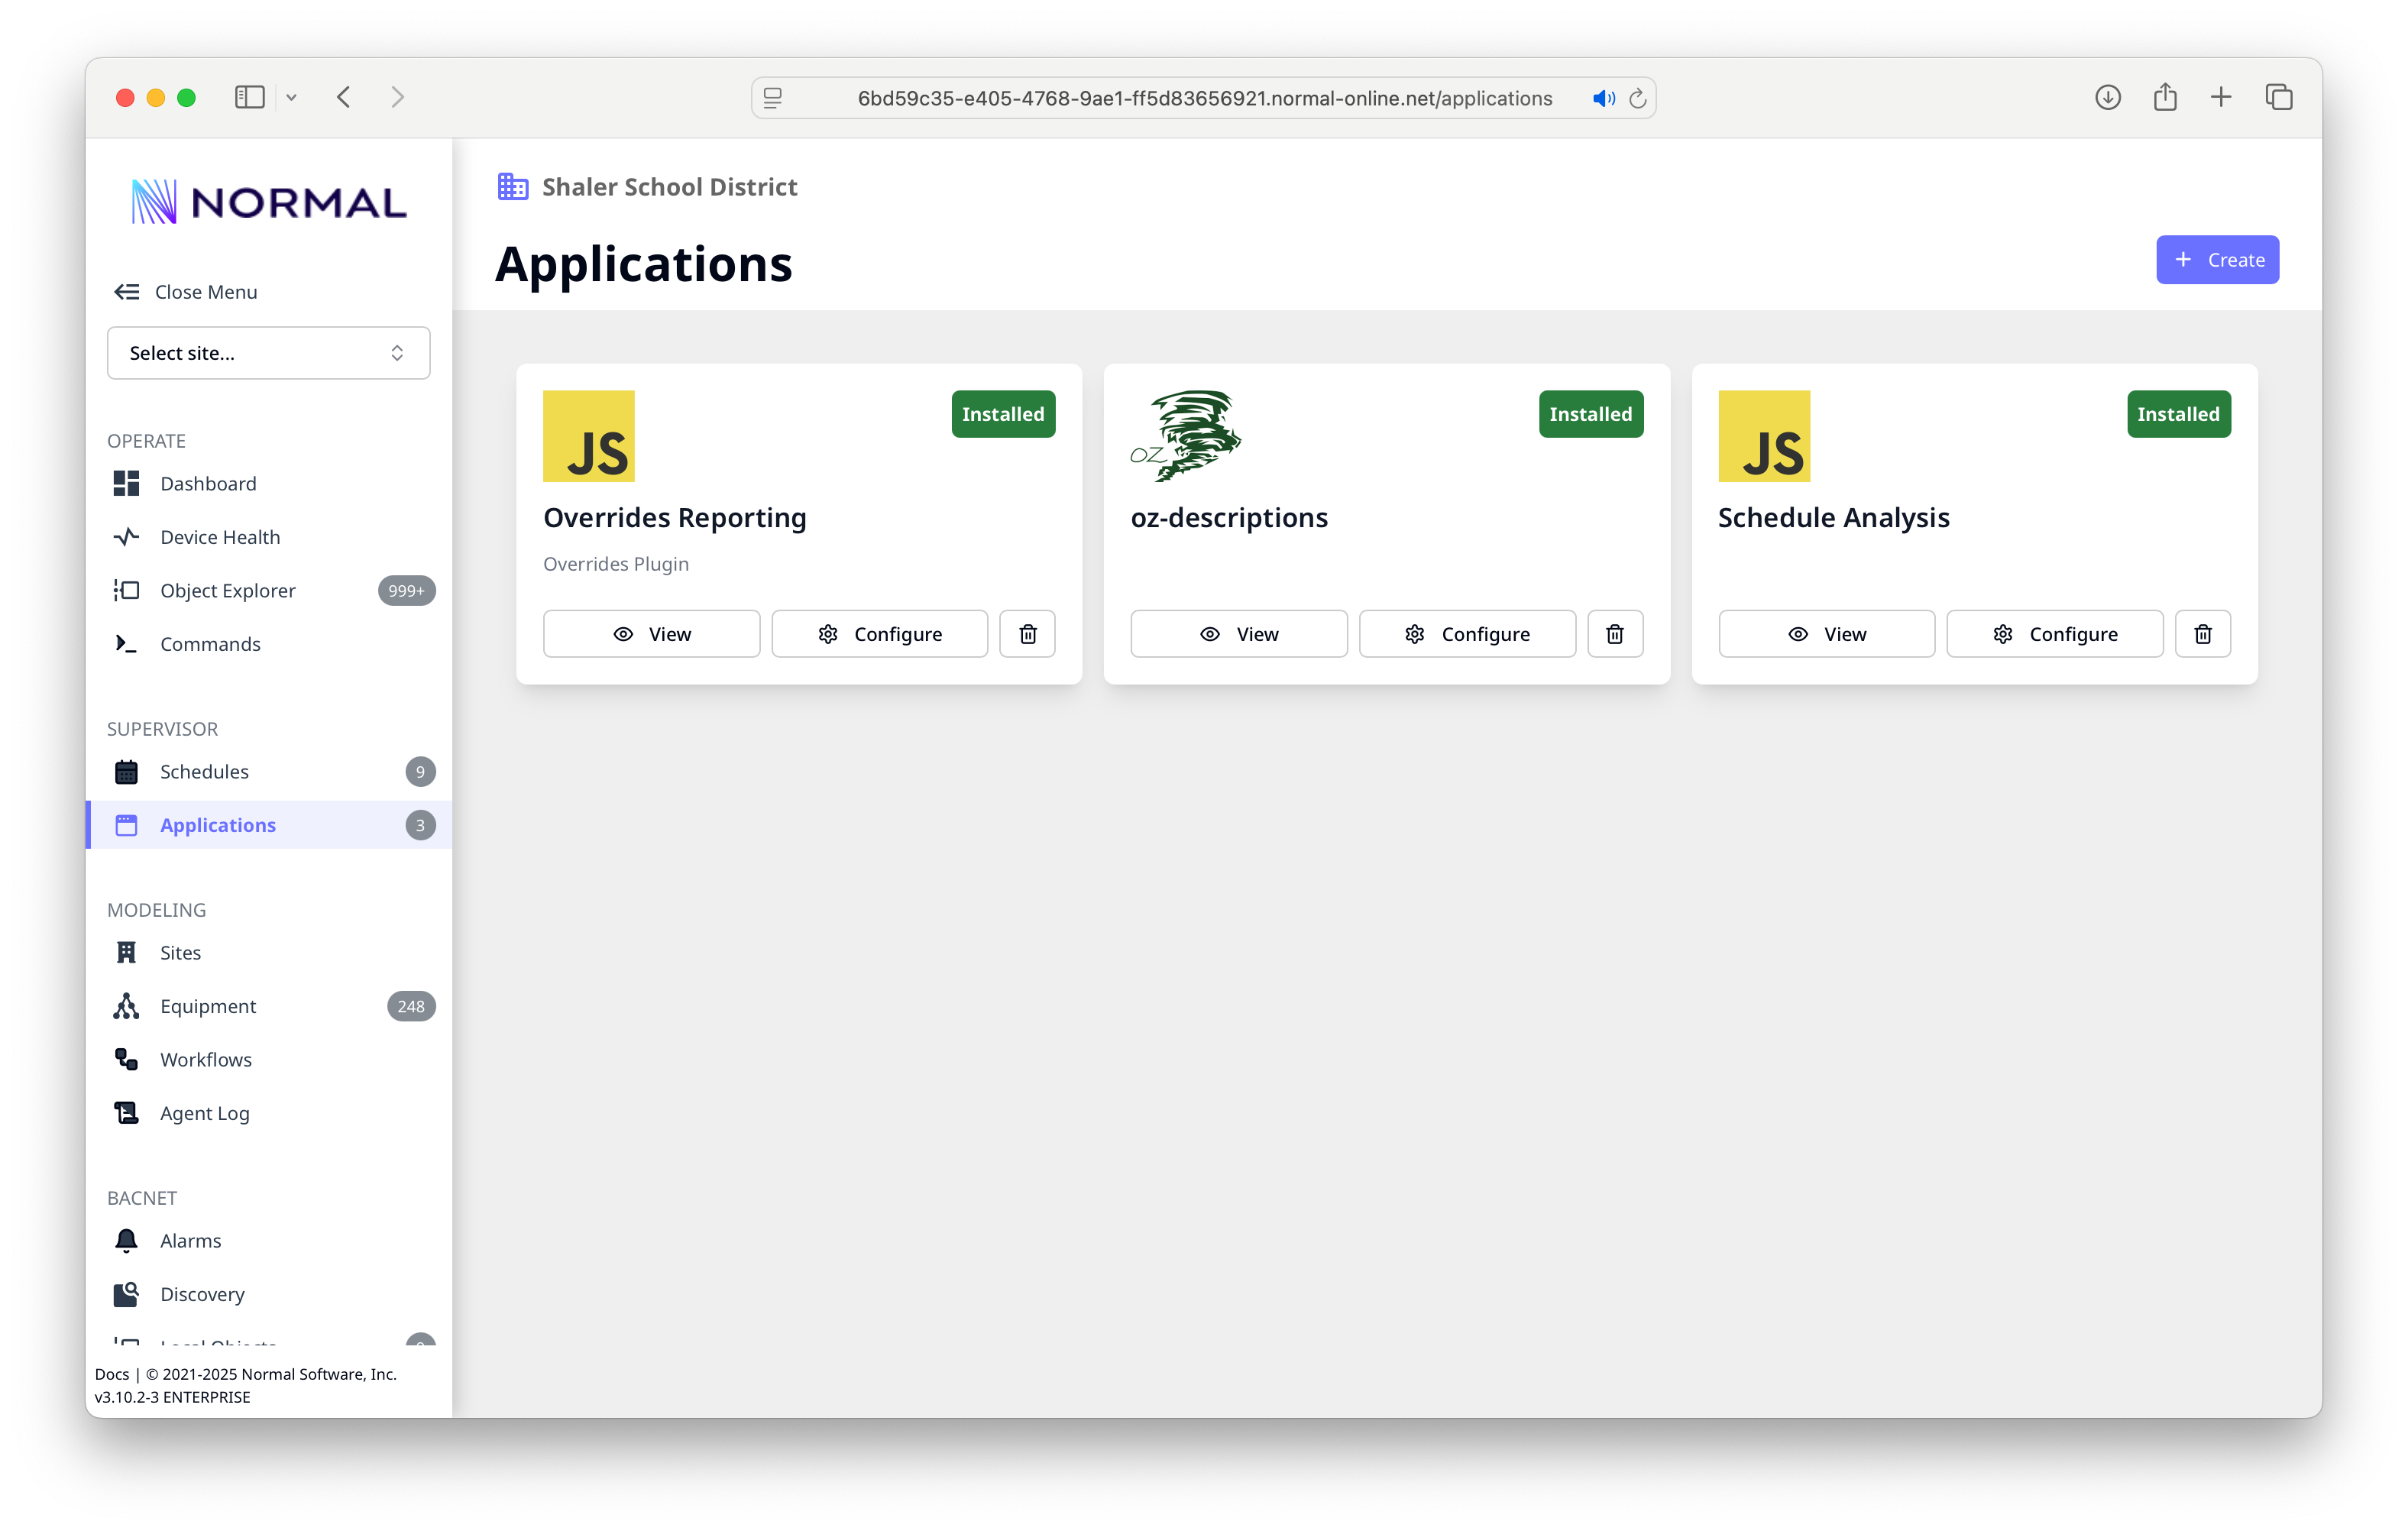
Manage NF SDK applications:
- App cards -- each installed app with its icon, name, and status badge
- View -- open the app's UI (if it provides one)
- Configure -- adjust app settings
- Create -- install a new app from a repository URL or upload
Configuration
Found under Settings > Configuration. Tune NF's behavior:
- BACnet -- timeouts, concurrency, merge settings
- Polling -- timezone for timestamp interpretation
- Sparkplug -- MQTT broker, group/node IDs, payload format
- Commands -- default write priority
- System -- site name displayed in the console header
See Configuration for a full reference of all settings.
Navigation Tips
- Site filter -- the dropdown in the top-left filters all views by site
- URL deep links -- most pages support direct URLs, so you can bookmark specific views or share links with colleagues
- Left nav sections -- organized by function: Operate (day-to-day), Supervisor (schedules and apps), Modeling (data normalization), and BACnet (protocol-level tools)